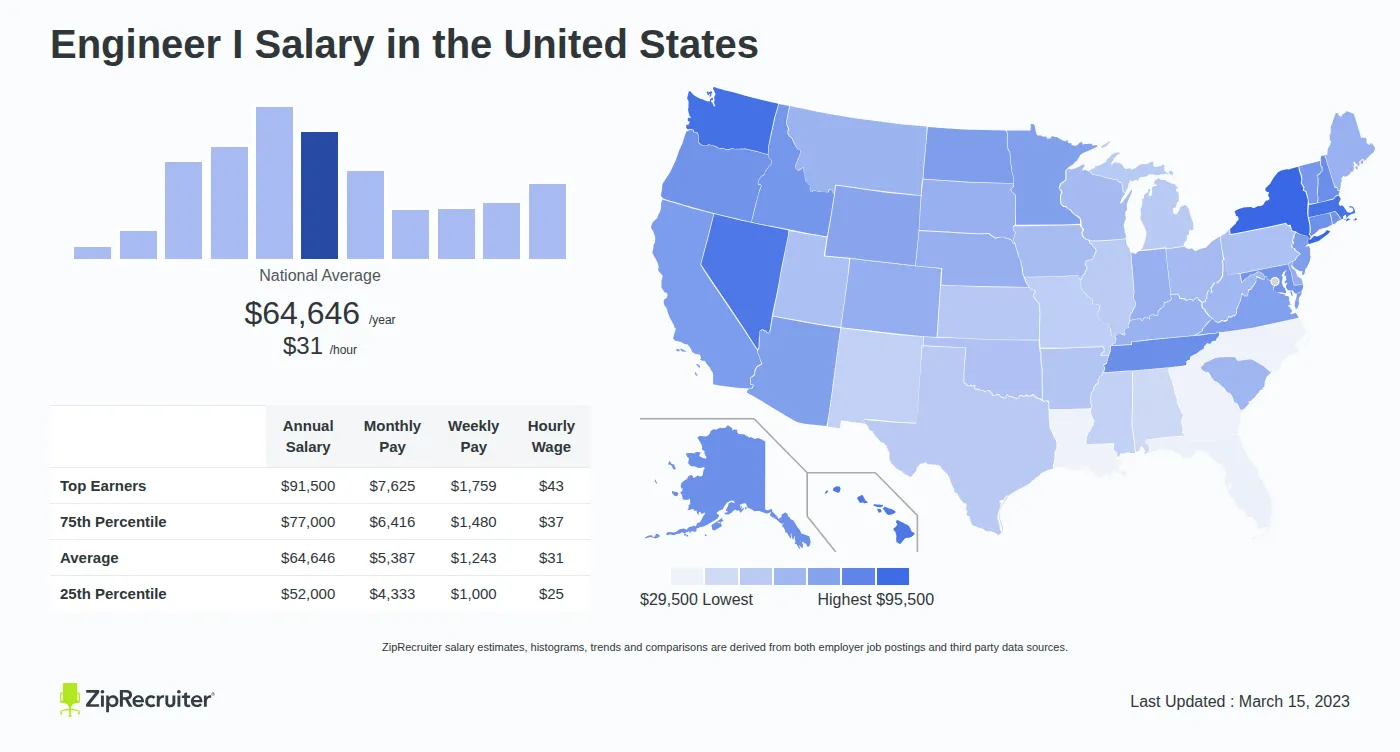
Engineer I Salary
$29.5K - $35.5K
1% of jobs
$35.5K - $41.5K
3% of jobs
$41.5K - $47.5K
11% of jobs
$51.6K is the 25th percentile. Wages below this are outliers.
$47.5K - $53.5K
13% of jobs
$53.5K - $59.5K
18% of jobs
The median wage is $60.5K / yr.
$59.5K - $65.5K
15% of jobs
$65.5K - $71.5K
10% of jobs
$73.6K is the 75th percentile. Wages above this are outliers.
$71.5K - $77.5K
6% of jobs
$77.5K - $83.5K
6% of jobs
$83.5K - $89.5K
7% of jobs
$89.5K - $95.5K
9% of jobs
$29.5K
$60.5K
$95.5K
$64,646
/year
$31.08
/hour
Do you get a good deal as an Engineer I?
Take The Breakroom Quiz to find out if your job offers fair pay and conditions. The 3-minute quiz lets you compare your pay, hours, benefits, and more.
Take The Breakroom Quiz

How much does an Engineer I make?
As of Sep 6, 2026, the average annual pay for an Engineer I in the United States is $64,646 a year.
Just in case you need a simple salary calculator, that works out to be approximately $31.08 an hour. This is the equivalent of $1,243/week or $5,387/month.
While ZipRecruiter is seeing annual salaries as high as $95,500 and as low as $29,500, the majority of Engineer I salaries currently range between $52,000 (25th percentile) to $77,000 (75th percentile) with top earners (90th percentile) making $91,500 annually across the United States. The average pay range for an Engineer I varies greatly (by as much as 25000), which suggests there may be many opportunities for advancement and increased pay based on skill level, location and years of experience.
An Engineer I in your area makes on average $0 per year, or $64,646 (100.000%) less than the national average annual salary of $64,646. Ohio ranks number 41 out of 50 states nationwide for Engineer I salaries.
To estimate the most accurate annual salary range for Engineer I jobs, ZipRecruiter continuously scans its database of millions of active jobs published locally throughout America.
Find your next high paying job as an Engineer I on ZipRecruiter today.
What are Top 10 Highest Paying Cities for Engineer I Jobs
We've identified 10 cities where the typical salary for an Engineer I job is above the national average. Topping the list is San Francisco, CA, , with Sunnyvale, CA, and Santa Clara, CA, close behind in the second and third positions. Santa Clara, CA, beats the national average by $8,754 (13.5%), and San Francisco, CA, furthers that trend with another $9,733 (15.1%) above the $64,646 average.
With these 10 cities having average salaries higher than the national average, the opportunities for economic advancement by changing locations as an Engineer I appears to be exceedingly fruitful.
Finally, another factor to consider is the average salary for these top 10 cities varies very little at 4% between San Francisco, CA, and Kentville, NS, , reinforcing the limited potential for much wage advancement. The possibility of a lower cost of living may be the best factor to use when considering location and salary for an Engineer I role.
City | Annual Salary | Hourly Wage |
|---|---|---|
San Francisco, CA | $74,379 | $35.76 |
Sunnyvale, CA | $73,733 | $35.45 |
Santa Clara, CA | $73,400 | $35.29 |
Fremont, CA | $73,183 | $35.18 |
Berkeley, CA | $72,210 | $34.72 |
San Jose, CA | $72,151 | $34.69 |
Santa Rosa, CA | $71,970 | $34.60 |
Livermore, CA | $71,835 | $34.54 |
Barnstable Town, MA | $71,712 | $34.48 |
Kentville, NS | $71,223 | $34.24 |
What are Top 5 Best Paying Related Engineer I Jobs in the U.S.
We found a few related jobs that pay more than jobs in the Engineer I category.
For example Cisco Systems Engineer jobs pay as much as $62,569 (96.8%) more than the average Engineer I salary of $64,646. If you're qualified, finding work as an Cisco Systems Engineer may help you make more money than that of the average Engineer I position.
Job Title | Annual Salary | Hourly Wage |
|---|---|---|
Cisco Systems Engineer | $127,215 | $61.16 |
Lead Programmer | $114,323 | $54.96 |
Voip Engineer | $109,219 | $52.51 |
Meraki | $88,094 | $42.35 |
Senior Configuration Analyst | $85,935 | $41.31 |
About Our Data
ZipRecruiter salary estimates, histograms, trends and comparisons are derived from both employer job postings and third party data sources.