1

Data Visualization Manager Jobs (NOW HIRING)

Strong knowledge of data visualization principles, information management, and data administration ... with 2-4 years of relevant experience. * Experience integrating and managing data from multiple ...

Strong knowledge of data visualization principles, information management, and data administration ... with 2-4 years of relevant experience. * Experience integrating and managing data from multiple ...

Showing results 41-60

Data Visualization Manager information

See salary details

$54K

$109.5K

$161.5K

How much do data visualization manager jobs pay per year?

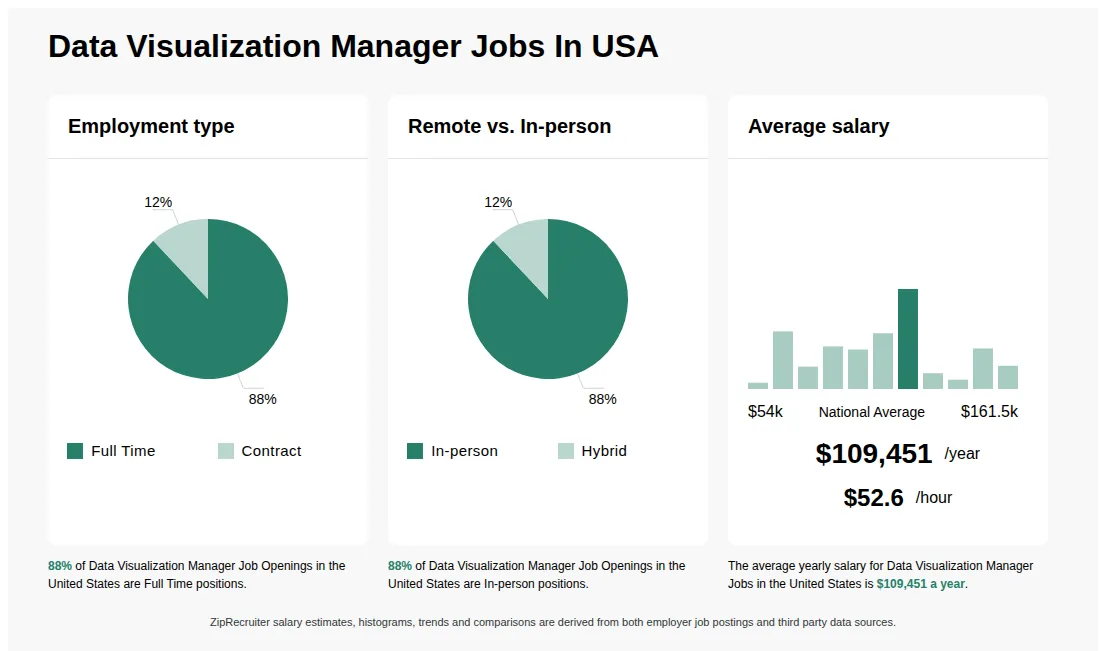
As of Sep 6, 2026, the average yearly pay for data visualization manager in the United States is $109,451.00, according to ZipRecruiter salary data. Most workers in this role earn between $90,000.00 and $123,000.00 per year, depending on experience, location, and employer.

What does a data visualization manager do?

A Data Visualization Manager leads teams in designing and implementing visual representations of data to help organizations make informed decisions. They collaborate with data analysts, business stakeholders, and IT professionals to translate complex data sets into clear, actionable insights through dashboards, charts, and interactive reports. Their role also involves ensuring data accuracy, selecting appropriate visualization tools, and maintaining best practices in data storytelling. Additionally, they often provide guidance and training to team members on effective visualization techniques.

What are the key skills and qualifications needed to thrive as a data visualization manager, and why are they important?

To thrive as a Data Visualization Manager, you need a strong foundation in data analysis, visualization techniques, and statistical knowledge, typically supported by a degree in data science, computer science, or a related field. Expertise in tools such as Tableau, Power BI, and programming languages like Python or R, as well as familiarity with data management systems, is highly valued. Exceptional communication, leadership, and problem-solving skills help bridge the gap between technical teams and business stakeholders. These abilities are crucial for transforming complex data into actionable insights that drive strategic decision-making.

What are some common challenges data visualization managers face when leading cross-functional projects?

Data Visualization Managers often navigate the challenge of aligning diverse teams, such as data analysts, designers, and business stakeholders, to ensure visualizations meet technical accuracy and business needs. Balancing the complexity of large datasets with the need for clear, actionable visuals can be demanding, especially when stakeholders have varying levels of data literacy. Effective communication, prioritizing user experience, and iterative feedback are crucial for overcoming these hurdles and delivering impactful visual solutions.

What is the difference between Data Visualization Manager vs Data Analyst?

AspectData Visualization ManagerData Analyst
Required CredentialsBachelor's or Master's in Data Science, Analytics, or related field; experience in data visualization toolsBachelor's in Statistics, Mathematics, or related field; proficiency in data analysis and visualization tools
Work EnvironmentLeads visualization teams, collaborates with stakeholders, manages projectsAnalyzes data sets, creates reports, supports decision-making
Employer & Industry UsageUsed across tech, finance, marketing, and consulting firmsCommon in finance, healthcare, marketing, and research organizations

The Data Visualization Manager focuses on leading teams and overseeing visualization projects, while the Data Analyst primarily analyzes data and creates visual reports. Both roles require strong skills in data tools, but the manager role emphasizes leadership and project management, whereas the analyst role centers on data interpretation and reporting.

More about Data Visualization Manager jobs

What cities are hiring for Data Visualization Manager jobs?

Cities with the most Data Visualization Manager job openings:

What are the most commonly searched types of Data Visualization jobs?

The most popular types of Data Visualization jobs are:

What states have the most Data Visualization Manager jobs?

States with the most job openings for Data Visualization Manager jobs include:

What job categories do people searching Data Visualization Manager jobs look for?

The top searched job categories for Data Visualization Manager jobs are:

Infographic showing various Data Visualization Manager job openings in the United States as of August 2026, with employment types broken down into 87% Full Time, 12% Part Time, and 1% Contract. Highlights an 87% Physical, 2% Hybrid, and 11% Remote job distribution, with an average salary of $109,451 per year, or $52.6 per hour.

Data VIsualization Specialist

VENESCO, LLC

Dayton, OH โ€ข On-site

Full-time

Re-posted 20 days ago


Job description

Description

The Data Visualization Specialist supports Public Health programs by transforming complex health, surveillance, and operational data into actionable visual insights for military leaders and decision-makers. The position combines data integration, analytics, dashboard development, business intelligence, and knowledge management to improve situational awareness and support evidence-based decision-making across the Air Force public health enterprise.

Requirements

  • Master's degree or Bachelor's degree with at least four years of experience in Data Science, Computer Science, Operations Research, or a related technical discipline.ย 
  • Strong knowledge of data visualization principles, information management, and data administration, with 2-4 years of relevant experience.ย 
  • Experience integrating and managing data from multiple health, surveillance, and military systems.ย 
  • Expert-level capability in data preparation, cleansing, modeling, optimization, and analysis of complex datasets.ย 
  • Proficiency with visualization and analytics tools such as Tableau, Power BI, SAS, Python, and R.
  • Ability to communicate complex technical information effectively to senior leaders and diverse stakeholders.
  • Ability to obtain and maintain HIPAA compliance training and protect sensitive health information.