2

Entry Level Data Visualization Jobs (NOW HIRING)

Data Scientist - NYC

Boston, MA · On-site

$100 - $200/hr

... data visualization tools * Create valuable insights from datasets directly with stakeholders ... entry-level data science concepts) * Experience writing code in Python * Experience handling ...

Data (Entry Level)

Syracuse, NY · On-site

$16.75 - $22.50/hr

Data Visualization. Presentation Skills. Machine Learning. Tools Used SQL, Teradata, Tableau, R, Python, SAS Start your career with a reputed organization like Google, Apple, eBay, Wal-Mart Labs ...

Job Summary Data Analyst 1 is an entry-level, developmental role designed to build foundational data analytics and visualization skills in preparation for progression to a Data Analyst 2 role. The ...

Job Summary Data Analyst 1 is an entry-level, developmental role designed to build foundational data analytics and visualization skills in preparation for progression to a Data Analyst 2 role. The ...

next page

Showing results 1-20

Entry Level Data Visualization information

See salary details

$10

$19

$26

How much do entry level data visualization jobs pay per hour?

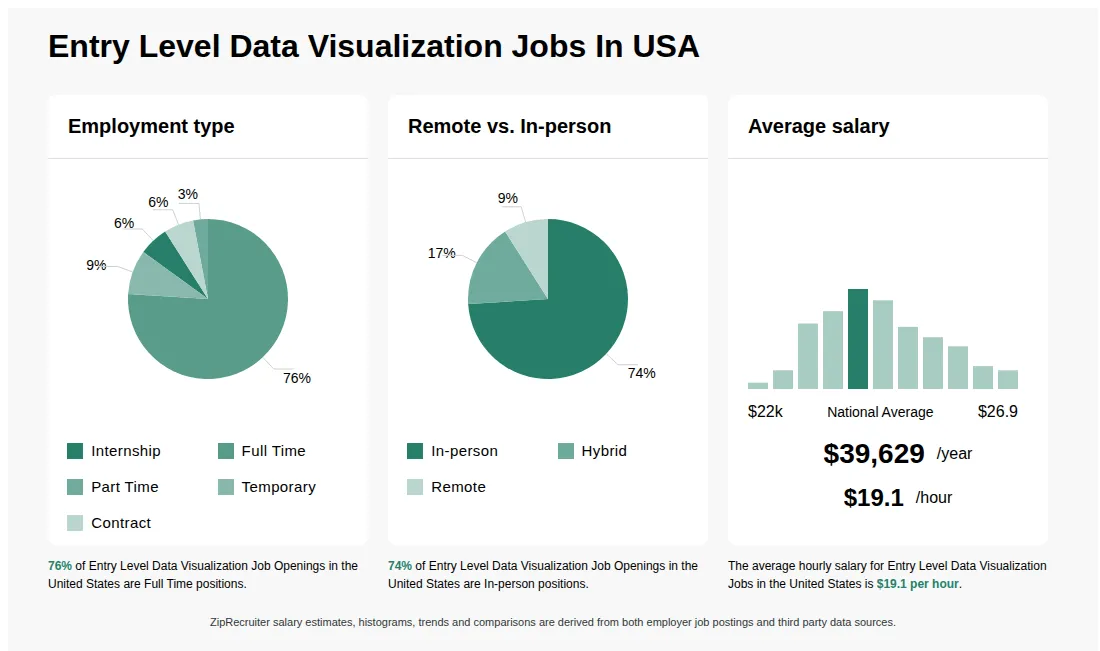
As of Jul 14, 2026, the average hourly pay for entry level data visualization in the United States is $19.05, according to ZipRecruiter salary data. Most workers in this role earn between $16.11 and $21.39 per hour, depending on experience, location, and employer.

What is an Entry Level Data Visualization job?

An Entry Level Data Visualization job involves creating charts, graphs, and dashboards to help analyze and communicate data effectively. Professionals in this role use tools like Tableau, Power BI, or Python libraries (e.g., Matplotlib, Seaborn) to present data in a clear and visually appealing way. They often work with data analysts and business teams to transform raw data into insights that drive decision-making. Strong analytical skills, attention to detail, and basic programming or SQL knowledge can be helpful in this role.

What are the key skills and qualifications needed to thrive in the Entry Level Data Visualization position, and why are they important?

To thrive as an Entry Level Data Visualization professional, you need a solid understanding of data analysis, basic statistical concepts, and visual storytelling, typically supported by a bachelor’s degree in a related field. Familiarity with tools such as Tableau, Power BI, or Excel, and basic programming knowledge in Python or R, are commonly expected and may be enhanced by certifications in data analytics or visualization. Strong communication, attention to detail, and a collaborative attitude help you explain complex data insights to diverse audiences and work effectively within cross-functional teams. These skills and qualities are essential for translating data into actionable insights and creating impactful visuals that inform business decision-making.

What are the typical day-to-day responsibilities of someone in an Entry Level Data Visualization role?

Entry Level Data Visualization professionals usually spend their days gathering data from various sources, cleaning or preparing it for analysis, and building charts, graphs, or dashboards to present findings. You’ll often collaborate with analysts, project managers, or business teams to understand project requirements and iterate on visual solutions based on feedback. Reviewing data accuracy, updating reports, and attending team meetings to discuss progress or new projects are also common. This role offers a great opportunity to sharpen both technical and communication skills while playing a key part in how your organization makes data-driven decisions.

More about Entry Level Data Visualization jobs
What cities are hiring for Entry Level Data Visualization jobs? Cities with the most Entry Level Data Visualization job openings:
What are the most commonly searched types of Data Visualization jobs? The most popular types of Data Visualization jobs are:
What states have the most Entry Level Data Visualization jobs? States with the most job openings for Entry Level Data Visualization jobs include:
Data Analytics & GIS Internship (Part-Time)

Data Analytics & GIS Internship (Part-Time)

City of Westerville

Westerville, OH

$33K - $44K/yr

Part-time

Posted 15 days ago


Job description

Description This position is open until filled. Applications are being reviewed as they are received. The purpose of the Data Analytics & Geographic Information Systems (GIS) Internship program is to provide students of Data Analytics & GIS-related studies with professional Data Analytics & GIS experience in a public sector organization.

This internship position will support citywide Data Analytics & GIS from the Information Technology (IT) department. This program is intended to provide part-time employment in the Data Analytics & GIS field. Upon the student's graduation and completion of the Data Analytics & GIS internship, the student should have received adequate training and experience necessary for an entry-level Data Analytics & GIS job.

SUPERVISION This position does not have any supervisory responsibilities. ESSENTIAL FUNCTIONS OF WORK A qualified candidate must be able to do the following: Perform entry level Data Analytics & GIS work, including the creation and maintenance of GIS data within ArcGIS Pro and ArcGIS Online. Assist in data clean-up and data quality testing.

Assist in producing printed and virtual maps for stakeholders. Assist in troubleshooting stakeholders' issues and training. Assist with creating and updating project documents and instructions.

Perform other related tasks as assigned. Careful review and attention to detail is a must. Data analysis and reporting from a variety of sources.

Use data visualization software to present findings. MINIMUM REQUIREMENTS OF WORK The applicant must be currently enrolled in a relevant undergraduate, graduate, professional certificate program such as Geography, Computer Science, Data Science, Management Information Systems, Environmental Sciences, Political Sciences, Public Administration, or other related fields. Applicants must have prior hands-on experience in an academic or project setting with Data Analytics or GIS Applications.

Must have effective time management and demonstrated ability to meet project deadlines and goals with minimal supervision. The position will require occasional travel within the municipality for field data collection and meetings with departments.