2

Remote Data Visualization Jobs (NOW HIRING)

REMOTE - Data Scientist

$101.54K - $175.73K/yr

Cincinnati OR Remote Travel Required: 2-3 times yearly Job Summary The Data Science team at ... visualization, model deployment, and pipeline orchestration. * Strong working knowledge of machine ...

Data Analyst (remote)

OR · On-site +1

$70K - $80K/yr

Remote optional for the right candidate. If remote, travel required to Naples headquarters ... As a data analytics and visualization specialist, you will enhance data utilization through ...

Our large client is looking for multiple consultants to join a growing Big Data project. Experience ... Visualization Engineer and Ingestion Engineers. All roles will be remote and can be located ...

Our large client is looking for multiple consultants to join a growing Big Data project. Experience ... Visualization Engineer and Ingestion Engineers. All roles will be remote and can be located ...

Data Analyst

Denver, CO · On-site +1

$80K - $100K/yr

Salary: $80k-100K + bonus + benefits Location: 100% remote for US-based candidates Responsibilities ... Data visualization * Data integration * ETL Development Qualifications: * Bachelor's Degree in ...

Sr. Data Analyst

$88K - $111.10K/yr

... be remote. The contractor would need to be in place by 1-Feb. What you will do: * Gather requirements from stakeholders to design Power BI, Tableau, and Looker reports following data visualization ...

Knowledge of data mining methods, databases, data visualization and machine learning. * Experience ... Remote Work: in an industry of declining remote work opportunities. * People-Focused Culture: we ...

Knowledge of data mining methods, databases, data visualization and machine learning. * Experience ... Remote Work: in an industry of declining remote work opportunities. * People-Focused Culture: we ...

Salary: $80k-100K + bonus + benefits Location: 100% remote for US-based candidates Responsibilities ... Data visualization * Data integration * ETL Development Qualifications: * Bachelor's Degree in ...

Remote Summary: The main function of the Data Scientist is to produce innovative solutions driven ... visualization support, which includes, but limited to support for the online customer service ...

Senior Data Analyst

Denver, CO · On-site +1

$90K - $120K/yr

100% Remote Full-time Senior Analyst At NuView Analytics - we help companies accelerate the time to ... Data visualization * Data integration * ETL Development * Statistical modeling and machine learning ...

Data Engineer - Remote

Manhattan, NY · On-site +1

$126.10K - $151.40K/yr

Remote Project Duration: 6-12 months Responsibilities: * Analysis, design, coding, performance ... Proven skills with data visualization tools: Microsoft Excel (PowerPivot, Pivot Tables, Slicers)

100% Remote Full-time Senior Analyst At NuView Analytics - we help companies accelerate the time to ... Data visualization * Data integration * ETL Development * Statistical modeling and machine learning ...

next page

Showing results 1-20

Remote Data Visualization information

See salary details

$54K

$109.5K

$161.5K

How much do remote data visualization jobs pay per year?

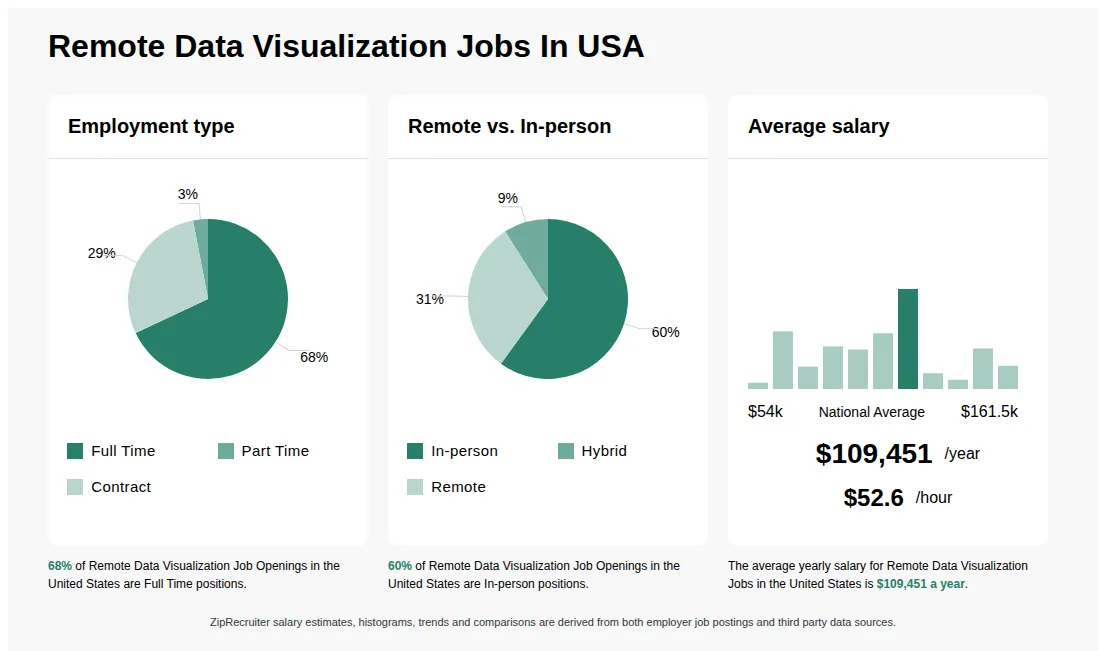
As of May 31, 2026, the average yearly pay for remote data visualization in the United States is $109,451.00, according to ZipRecruiter salary data. Most workers in this role earn between $90,000.00 and $123,000.00 per year, depending on experience, location, and employer.

What Are Remote Data Visualization Jobs?

A remote data visualization job allows you to work from home while assisting with the process of data visualization projects for a company. Your responsibilities may include reviewing analytics, creating engaging and interactive tools, portraying data in a visual way, developing presentations, interpreting data, and collaborating with other departments. You handle modeling, create charts and graphic depictions, gather datasets, produce reports, measure performance, and fulfill additional project duties as needed. You can find data visualization positions in various industries. Data visualization specialist, data visualization analyst, data visualization engineer, and data visualization director are some common job titles.

What are the key skills and qualifications needed to thrive as a Remote Data Visualization Specialist, and why are they important?

To thrive as a Remote Data Visualization Specialist, you need a strong background in data analysis, statistical concepts, and visual storytelling, often supported by a degree in computer science, statistics, or a related field. Expertise in tools such as Tableau, Power BI, or D3.js, as well as proficiency with programming languages like Python or R, is typically required. Excellent communication, creativity, and problem-solving skills help you convey complex data insights clearly and collaborate effectively with remote teams. These competencies are crucial for transforming raw data into actionable insights that drive informed business decisions in a virtual work environment.

How do remote data visualization specialists typically collaborate with cross-functional teams to deliver insights?

Remote data visualization specialists often work closely with data analysts, engineers, and business stakeholders via virtual collaboration tools. Regular video meetings, shared dashboards, and real-time feedback channels help ensure that visualizations align with project goals and stakeholder needs. Clear communication and documentation are essential for managing expectations and iterating on designs. Building strong relationships with distributed teams and being proactive in seeking and providing feedback are key to delivering effective data-driven stories.

What is remote data visualization?

Remote data visualization refers to the practice of creating interactive charts, graphs, and dashboards to represent data insights, while working outside of a traditional office environment. Professionals in this field use tools like Tableau, Power BI, or D3.js to help organizations make informed decisions by presenting complex data in an understandable visual format. Working remotely allows data visualization specialists to collaborate with teams across different locations using cloud-based platforms and virtual communication tools.

What is the difference between Remote Data Visualization vs Remote Data Analyst?

AspectRemote Data VisualizationRemote Data Analyst
Required CredentialsDegree in Data Science, Computer Science, or related field; proficiency in visualization toolsDegree in Data Analysis, Statistics, or related; strong analytical skills
Work EnvironmentPrimarily focused on creating visual representations of data, often using tools like Tableau, Power BIAnalyzing datasets, generating reports, and providing insights, often using Excel, SQL, and statistical software
Industry UsageUsed across tech, finance, marketing, and consulting firms for presenting data insights visuallyCommon in finance, healthcare, retail, and marketing for data interpretation and decision-making

Remote Data Visualization specialists focus on designing visual data representations to communicate insights effectively, while Remote Data Analysts analyze data sets to generate actionable insights. Both roles require analytical skills, but their core tasks and tools differ, making them distinct yet complementary positions in data-driven organizations.

What cities are hiring for Remote Data Visualization jobs? Cities with the most Remote Data Visualization job openings:
What are the most commonly searched types of Data Visualization jobs? The most popular types of Data Visualization jobs are:
What states have the most Remote Data Visualization jobs? States with the most job openings for Remote Data Visualization jobs include:
Infographic showing various Remote Data Visualization job openings in the United States as of May 2026, with employment types broken down into 3% As Needed, 10% Full Time, 68% Part Time, 1% Temporary, and 18% Contract. Highlights an 12% Physical, 9% Hybrid, and 79% Remote job distribution, with an average salary of $109,451 per year, or $52.6 per hour.
REMOTE - Data Scientist

$101.54K - $175.73K/yr

Full-time

Retirement

Posted 18 days ago


Job description

Join PatientPoint to be part of a dynamic team creating change in and around the doctor's office. As a leading digital health company, we innovate to positively impact patient behaviors. Our purpose-driven approach offers an inspirational career opportunity where you can contribute to improving health outcomes for millions of patients nationwide.
Location: Cincinnati OR Remote
Travel Required: 2-3 times yearly
Job Summary
The Data Science team at PatientPoint works on business problems across the enterprise, such as provider growth, pricing, operations, marketing, campaign measurement, and customer attrition.As a Data Scientist, you'll impact the organization by creating data products that synthesize available data into useful predictions, enable manual processes to be automated, and provide digestible information for human-in-the-loop decisions.
WhatYou'llDo
  • In this role, you'll work with a cross-functional team to enhance PatientPoint's durable provider growth strategy.
  • You'll be a core member of the team responsible for modeling the value of providers in the market and creating data pipelines that prioritize recruitment.
  • To be successful, you'll develop a deep understanding of the goals and constraints of the provider growth team and leverage machine learning, analysis, and data storytelling techniques to move the business towards its goals.
  • To stay organized, you'll work in Git, participate in code reviews, and keep your work documented (Jira, Confluence, READMEs) .
  • To maximize impact, you'll proactively share insights with your cross-functional collaborators and data science team.

What We Need
  • Bachelorsdegree inApplied Statistics, Computer Science,Operations Research, Business Analytics, InformationSystemsor a related field.
  • 2+ years of related data science experience developing data products, deploying models to production, and delivering analyses to internal and external stakeholders.
    • Candidates will be asked to provide examples from theirprevious experienceand/or complete aprojectusing analytics to create actionable insights.
  • Fluency in Python and SQL, with end-to-end data stack experience including manipulation, analysis, visualization, model deployment, and pipeline orchestration.
  • Strong working knowledge of machine learning and data science methods including model training, model validation and selection, backtesting, and statistical testing.
  • Experience taking models from development to production, monitoring performance, and iteratively improving over time.
  • Strong communicationskills and a collaborative attitude for working with stakeholders.

Desired Qualifications
  • Masters or doctoral degree inApplied Statistics, Computer Science,Operations Research, Business Analytics, InformationSystemsor a related field.
  • Professional experience in healthcare, pharmaceutical,and digital advertising industries.
  • Strong grasp of MLOps practices and software engineering principles.
  • Experience with Snowflake, Airflow, HEX, Cursor, Claude Code.

What You'll Need to Succeed
  • Curious self-learner that enjoys staying current on emerging methods and trends and sharing with the team and others around them.
  • Highly self-motivated and self-directed.
  • Critical thinking with the ability toidentifyand scope and solve ambiguous problems in a fast-paced environment.
  • The ability to empower others through data storytelling - translating complex data findings into compelling narratives. Comfortable not onlypresenting the data but also explaining the insights in a context that resonates withtheaudience.
  • Strong interpersonal,communication,and consulting skills. Ability toestablishand maintain successful cross functional relationships and collaborate closely with multiple teams including engineering, product management, and business stakeholders.
  • Enthusiasm for responding to a dynamic range of questions and analytical challenges.

Base Salary Band: $101,542 - $175,732
Compensation: At PatientPoint, we are committed to providing competitive pay and benefits that are in line with industry standards. We analyze and carefully consider several factors when determining compensation, including skills, qualifications, geographic location, and professional experience, which can cause your compensation to vary. The base salary range listed is just one component of PatientPoint's total compensation package for employees. For additional details on our total benefits package, please review the section "About PatientPoint" at the end of this job description.
About PatientPoint:PatientPoint® is the Point of Change company, transforming the healthcare experience through the strategic delivery ofbehavior-changing content at critical moments of care. As the nation's largest and most impactful digital network in 30,000 physician offices, we connect patients, providers and healthbrands with relevant information that is proven to drivehealthier decisions and better outcomes. Learn more atpatientpoint.com.
Latest News & Innovations:
  1. Why is PatientPoint a Best Place to Work! Read More
  2. Teammate Honored as "Top Woman in Tech". Read More
  3. Recognized on Vault's Top Internship List. Read More

What We Offer:
We know you bring your whole self to work every day, and we are committed to supporting our full-time teammates with a comprehensive range of modernized benefits and cultural perks. We offer competitive compensation, flexible time off to recharge, hybrid work options, mental and emotional wellness resources, a 401K plan, and more. While these benefits are available to full-time team members, we strive to create a positive and supportive environment for all teammates.
PatientPoint recognizes that privacy is important to you. Please read the PatientPoint privacy policy, we want you to be familiar with how we may collect, use, and disclose your information. Employer is EOE/M/F/D/V