In the wise words of every opinion piece, Thanksgiving dinner, or barroom chat ever: “Things aren’t the way they used to be.” This classic sentiment (yes, I recognize the irony) is applied perhaps nowhere more than with the labor market. The most discussed differences (among many) are risk (“Companies aren’t committed to their workers anymore”), tenure (“No one works for one company their whole career anymore”), and benefits (“What’s a `pension’?”). Perhaps the most extreme example is the rise of contractors.
Contractors are individuals who perform services for a firm but are never technically employees. This typically means that they work only for a fixed period (sometimes with the possibility of more permanent employment afterward), they’re not eligible for benefits like health insurance or workers’ compensation, and there’s more risk that they suddenly find themselves without work. Contractors make up a big and growing share of the US workforce. Some people love it, because it offers more flexibility and freedom.
As an example, when we use our data and compare openings for contractors or employees in the same occupation, those for contractors are 2 and a half times more likely to allow working from home (which we know most workers value). But other workers find it stressful, partly because of the lack of benefits. For instance, contractor openings are 75% less likely to offer health insurance than similar openings for employees.
But why does an employer choose to use a contractor instead of an employee? While speculation is rampant, there’s actually no systematic data-driven evidence. So we made some.
We looked at about 5 million openings posted on ZipRecruiter since the start of 2016 and focused on 6 specific factors to understand how they influenced the contractor vs. employee decision. We go through each of them one by one, but if you’re interested in the summary of all 6 (and the comparison of which is most important) then go ahead and skip to the end.
Six Drivers of the Contractor vs. Employee Choice: One by One
Social Skills
Let’s start by talking about talking. Jobs that require social skills are critical to the US labor market. In fact, they’re almost the only ones seeing employment or wage growth. So these jobs are pretty important and we started by seeing whether employers are more or less likely to fill their needs with contractors.
We turned to O*NET to see how important social skills are in an occupation (following existing work from the economist David Deming). We then looked at how frequently posts in these occupations are looking for a contractor. Figure 1 shows the results, with occupations broken up into three equal-sized groups (low, medium, and high importance). Because salaries are higher for more social jobs (as Deming showed), we’ve controlled for each occupation’s typical pay.
Figure 1. Jobs with High Social Skills Demands Less Likely to Use Contractors
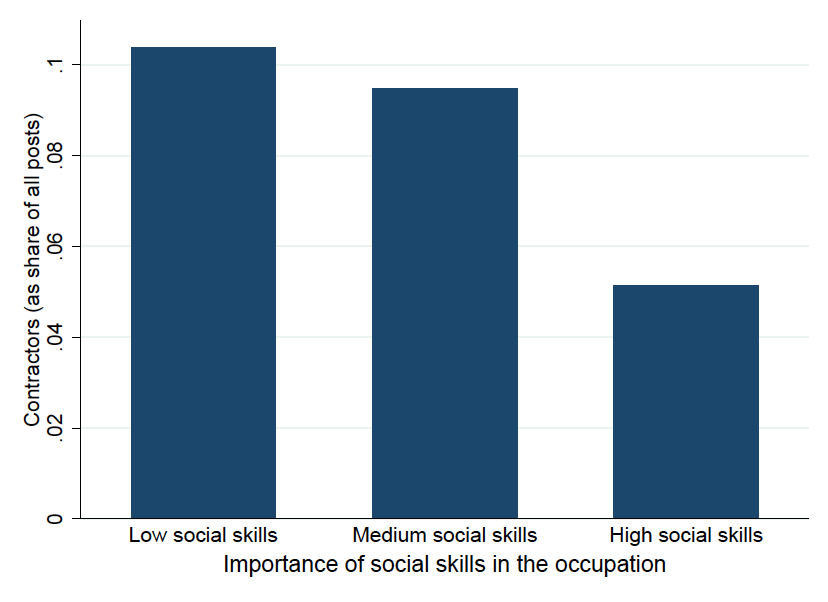
As you can see, compared to jobs where social skills have low or medium importance, jobs where social skills are highly important (the top third of jobs) are half as likely to be posted for contractors. One possible explanation is that social jobs require maintaining personal relationships. Contractors have much higher turnover and shorter tenure with the firm, and so if a job is going to require a lot of social interaction, employers might want workers to stick around a while. Whether or not that’s the case, more social jobs are less likely to hire contractors. We can chalk that up as one more benefit of social skills.
Rapidly Changing Industries
As we’ve said, one implication of high turnover/low tenure among contractors is that workers who leave can take existing relationships them, which can be disruptive to your business. But short tenure isn’t all bad: For firms in industries where business needs are constantly and rapidly evolving, the high turnover of contractors can help firms stay flexible and competitive. This is exactly what we found.
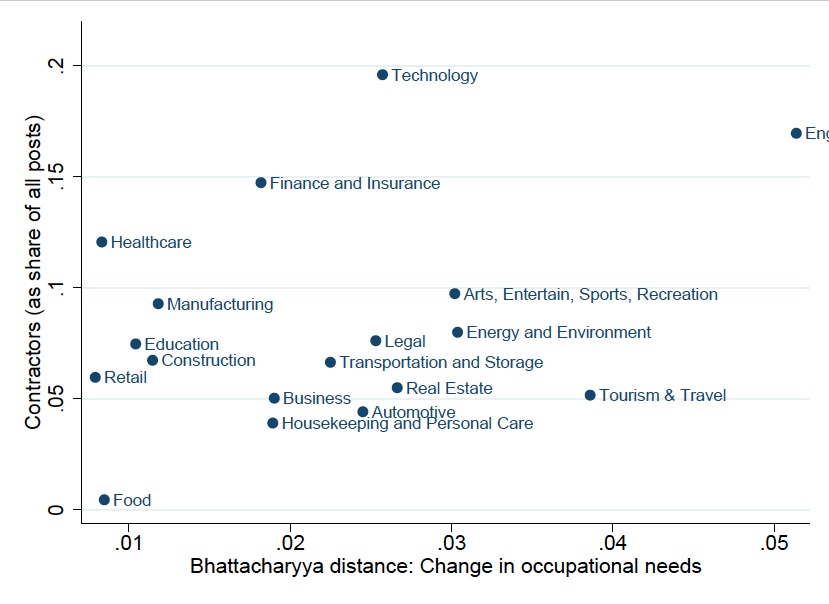
To figure out which industries experience more change in their labor needs, we turned to the Current Population Survey, the main government dataset used by labor economists (shout out to IPUMS for all their great work making this data easy to use). For each industry, we calculated the sets of occupations its employees held. Then, we calculated how much this set of occupations changed between 2012 and 2017, using the Bhattacharyya distance (named for Indian statistician Anil Kumar Bhattacharya) to calculate the “distance” between the 2012 and 2017 sets of occupational demands.
Industries where the 2017 occupations are very different from the 2012 occupations are those we think are experiencing rapidly changing labor needs. This works pretty well: The industries experiencing the most change are engineering and science, energy and the environment, and tourism and travel, all industries with well-documented upheavals in the last 5 years. On the other hand, those experiencing the least change are retail, food services, and healthcare, all relatively stable industries.
Figure 2 shows that the industries experiencing the most the most radical change in labor needs are also the ones that use contractors the most. This makes sense. Using contractors keeps firms nimble for when their labor needs suddenly shift with the next revolution of technology or (in the case of the tourism industry) culture.
Figure 2. Industries with Rapidly Changing Labor Needs Use More Contractors
Labor Supply
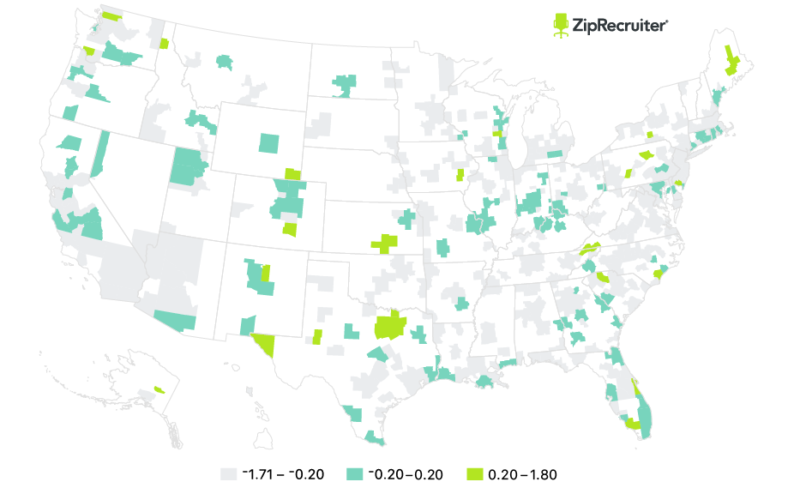
Looking for a needle in a haystack is a whole different process than looking for hay in a haystack. When the workers you need are rare locally, you might use different search, recruiting, and hiring methods than if you’re looking for a software developer in San Francisco, a petroleum engineer in Houston, or a biochemist in St. Louis.
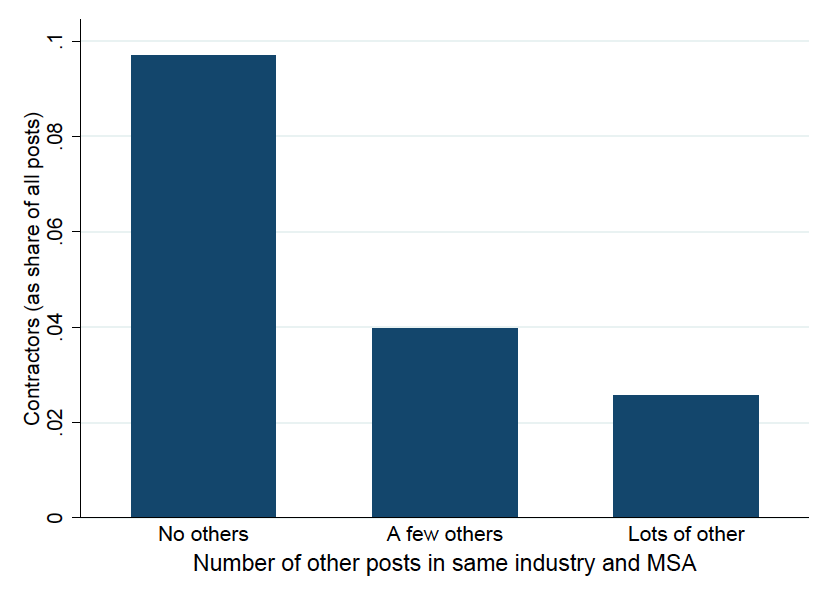
So we decided to measure the level of labor supply, or the number of available workers in the area. We used the American Community Survey, the largest government survey collecting detailed employment information, and calculated the number of workers in the same occupation and the same MSA as the post (again, thanks IPUMS!). When the MSA has lots of workers in the same occupation, you can imagine that it will be pretty easy for the firm to find a qualified candidate. When they’re pretty rare, it might be tough.
How does this affect the decision to post an opening for a contractor or an employee? Figure 3 shows the results. Rather than show you all 5 million posts (too many dots!), we broke posts into 15 equally sized buckets and show you the data as a “binned scatterplot.” We also use a log scale, which makes it easier to read, I promise.
And the powerful fact that jumps out of Figure is that posts for contractors are way less common when there are lots of qualified workers nearby. When their city has as few as 10 workers in the same occupation they’re looking for, firms post for a contractor 9% of the time. But when there are more like 10,000 similar workers in the city, that number is more like 4%. In other words, contractors are most important when firms are looking for a rare worker, probably because they know they’ll have a hard time attracting such a worker.
Figure 3. Contractors Less Common When Lots of Qualified Workers Are Locally Available

Company Size
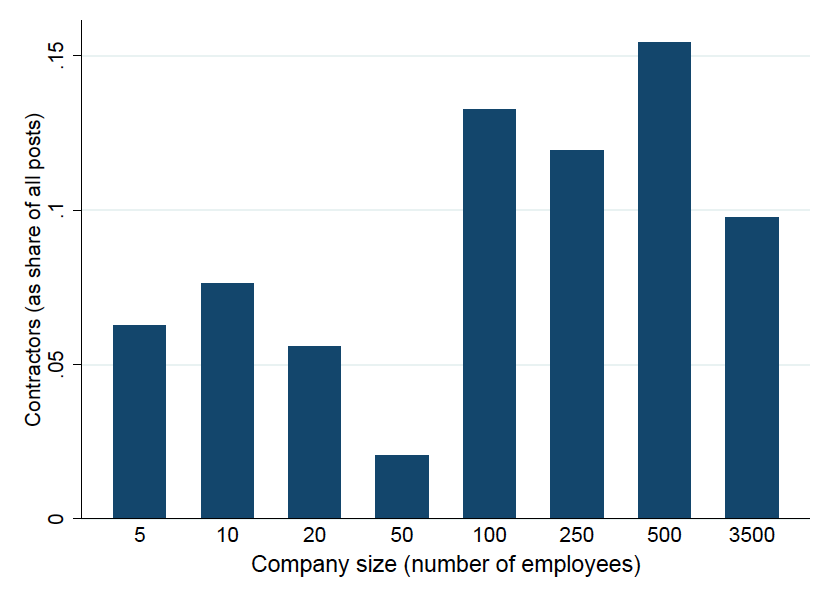
Big companies and small ones compete differently in the labor market, partly because big companies tend to have more developed legal and HR teams, name recognition, and more work available that allows them to hire into very specialized positions. All three of these factors would suggest that big companies would be more likely to use contractors, and indeed Figure 4 shows that they are.
The figure shows rates of contractor positions depending on the size of the company. Broadly speaking, companies can be split into two groups: Those with 50 or fewer employees (where about 5-7% of openings are for contractors) and those with 100 or more employees (where 10-15% are).
Figure 4. Big Companies Use More Contractors
As we said, there are lots of potential reasons for this. The Affordable Care Act means that firms with 50+ employees have a stronger incentive to hire contractors than small companies, although the employer mandate has been repealed. On the other hand, regardless of the ACA, companies can get into a lot of trouble for classifying workers as contractors but treating them as employees (Vizcaino v. Microsoft and a handful of cases brought against Uber are important here), so small companies with small legal staffs might be hesitant to mess with this risk. Also, jobs at big companies tend to be more specialized (the jacks-of-all-trades are less common) and searching for specialized skills is one of the most common reasons people recommend turning to contractors. Thus, the United States’ “contractor problem” might be a reflection of the “big business problem.”
At this point, it’s not so easy to distinguish between these (and more!) stories. If it’s the ACA, then we might see this pattern disappear. If it’s the legal risk of misclassification cases, it will depend on what happens in the courts. If it’s worker specialization, then it’s hard to imagine this pattern going anywhere. So rather than speculate, we’ll stick to the simple facts: Big companies use more contractors.
Education
College-educated and non-college workers differ in many ways. College graduates are more mobile (more likely to move to a different city); tend to have a more specialized, narrowly-focused, less broad skill set; and employers have more information about their skills (grades in engineering courses tell you a lot about an engineer’s quality; grades in high school math tell you little about anyone).
All of these factors can figure into the contractor vs. employee calculation. If workers are expected to move, maybe it’s better not to make long-run commitments; if workers are very specialized it’s easier to use a contractor to get exactly what you need; if you lack information about a worker’s quality, maybe you’d like to try them out as a contractor first. Overall, the total effect of education on the decision to hire an employee or a contractor is hard to predict. So we asked the data.
We took each occupation and calculated the fraction of posts that specifically list a Bachelor’s degree as one of the qualifications. Then we compared rates of contractor openings and rates of Bachelor’s requirements across these occupations (again using a binned scatterplot). The results are shown in Figure 5. As you can see, jobs that are more likely to require a college degree are also more likely to use contractors. The occupations that rarely require a college degree are roughly half as likely to look for contractors as those which most frequently require one.
Figure 5. Jobs Requiring College Degree More Likely to Use Contractors

Employer Power
We’ve already shown you that big and small companies differ in their use of contractors. But not all big or small companies are the same. Sometimes a company (big or small) plays a huge role in the city (at least within its industry), and sometimes it’s kind of just another option. Does this affect the decision to use a contractor?
Economists refer to this as monopsony power: The idea that the company is a powerful source of demand for workers. But to save on jargon, I’ll just say that an employer is “powerful” when they account for a large share of local job openings in the industry. So we took each company, and calculated the total share of openings in its city and industry that were posted by it.
The results are shown in Figure 6. Many companies only posted a single opening, so they ended up accounting for a tiny share of local openings. For these companies, almost 10% of openings are looking for a contractor. But other companies accounted for a big share of local openings, and for those companies, it was much more rare to use contractors. For the companies that accounted for the biggest share of openings in their local area and industry, less than 3% of openings were looking for contractors.
Figure 6. Companies that Dominate Local Labor Market Prefer Employees
Importantly, this result holds even if we control for company size (see the technical notes below). Thus, we conclude that companies that dominate the local labor market in their industry tend to prefer employees to contractors, potentially because their local influence allows them to attract a better pool of workers.
Putting It All Together
So how do we put all this together? We’ve considered six different factors, but the graphs above make it hard to compare. So we ran a simple regression to predict whether an opening was posted for a contractor or an employee as a function of all these characteristics. We “normalized” each one to have a standard deviation of one. If you don’t know what that means that’s ok, just think of it as allowing us to compare the size of these very different factors.
The results are shown in Figure 7. The top row shows that on average, openings for contractors account for about 7.8% of all ZipRecruiter posts. For occupations with high levels of social skills, this drops down to about 6%. For industries experiencing more rapid change in their labor needs, it rises to 8.7%. When the local labor market has lots of available workers (lots of workers with the same occupation), it’s again down, this time to around 6.8%. For big companies, it’s as high as 9.1% and for occupations that most often require a Bachelor’s degree it’s 9.3%. Finally, when the employer accounts for a big share of local openings (when they have a lot of power), use of contractors falls to 6.5%
Figure 7. Comparing the Effects of Different Factors

All of these factors are statistically significant, and these results control for occupational salaries and for MSA populations. The technical notes offer more detail.
Conclusion
So what do we make from all this? It’s not so simple. Some results suggest that rising contractors are an unavoidable sign of the times (like the fact that fast-paced industry change increases use of contractors or that jobs requiring a college degree are more likely to use contractors).
Some results suggest that the real story is more powerful than existing data shows. For instance, jobs with social skills have been exploding lately (and that’s likely to continue). So rising rates of independent contractors in spite of that shift makes the underlying trend even more stronger.
Should we worry? Again, it’s not so clear. Big companies use more contractors, and so if rising rates of contracting give them an edge over small companies and make it harder those companies to compete, then clearly there’s cause for concern. On the other hand, if there’s a lot of healthy competition in the labor market, then no one company ends up with much power, and the results suggest use of contractors should rise. So maybe contractors are a sign of healthy competition.
The rising use of independent contractors is a complicated trend. As we’ve discussed, some workers love this lifestyle, while others don’t feel they really have much choice. Views differ. Thus far, there’s a lot of disagreement about what’s driving the increase in independent contractors, what it means, and what can be done about it.
But at ZipRecruiter, we believe decisions should be made based on facts. So far, there’s been no major data-driven effort to understand why employers choose employees or contractors. We’ve tried to lay down some basic facts that can inform these discussions going forward. Because if there’s anything these results suggest, it’s that independent contractors aren’t going to disappear on their own.
Technical Notes
The sample for all analyses is all posts from Jan 2016 to Feb 2018, excluding recruiting firms, non-profit and government posts, and posts outside of the US.
The core regression (on which Figure 7 is based) is based on 3 million posts. As we said, we felt it was important to control for salary so we did so very flexibly. For both O*NET occupation codes and our own occupation codes, we calculated median salary among posts where salary was included. We included these two measures of median salary, each as a third order polynomial. We also controlled for a dummy for whether the job was in a metropolitan area, and (if so) the log population of that MSA.
IPUMS citations:
Steven Ruggles, Katie Genadek, Ronald Goeken, Josiah Grover, and Matthew Sobek. Integrated Public Use Microdata Series: Version 7.0 [dataset]. Minneapolis: University of Minnesota, 2017. https://doi.org/10.18128/D010.V7.0.
Sarah Flood, Miriam King, Steven Ruggles, and J. Robert Warren. Integrated Public Use Microdata Series, Current Population Survey: Version 5.0. [dataset]. Minneapolis: University of Minnesota, 2017. https://doi.org/10.18128/D030.V5.0.