
The latest employment numbers are in, and the news is all good: 295,000 jobs were created in February, and the updated unemployment of 5.5% is the lowest since rate since 2008. A stable, sustained economic recovery now seems to be well under way.
To supplement the government numbers on employment, we analyzed activity across hundreds of thousands of job postings to determine demand for hiring in February, which gives a predictive look at what real hiring will look like in March.
Key Findings:
According to the ZipRecruiter New Job Posting Index, Business Support Services was the big mover in February, with relative demand ticking up +1.04% month over month, followed by Manufacturing (+.86%) and Retail (+.66%). Warehousing and Storage jumps into the top 5 this month with a +.49% surge in demand, while the need for Construction workers continues to accelerate in 2015, edging up +.44% over January (see Table 1).
Industries experiencing relative demand contractions include Insurance (-.46%), Healthcare (experiencing a rare down month at -.43%) and Finance, which dropped a modest -.08%.
Our predictive analysis of the top five industries by demand shows the following 60-day outlook (see Graphs 1-5):
- Hiring in Business Services should recover from its brief slump
- The lag in time from job posting to hiring in Manufacturing will continue to close
- Retail hiring is set to surge in the wake of the post-holiday contraction
- Demand for Warehousing and Storage workers will approach an 18-month high
- Construction’s long slump should end, with a sharp uptick in hiring foreseen
We also measure the largest change in relative demand for hiring by city (MSA’s).
Demand in February experienced the highest relative growth in the following cities (see Table 2):
The five cities with the largest relative decline in demand for new workers in February:
The top job titles by job posting volume in February (full list in Table 3):
- Sales Representative
- Administrative Assistant
- Registered Nurse
- Customer Service Representative
- Project Manager
- Bank Teller
- Social Worker
- Account Manager
- Sales Associate
- General Labor
Table 1
Relative Strength of Active Jobs by Job Category - February 2015
| Job Category | Relative Change | |
|---|---|---|
| 1. | Business Support Services | +1.04% |
| 2. | Manufacturing | +0.86% |
| 3. | Retail trade | +0.66% |
| 4. | Construction | +0.44% |
| 5. | Warehousing and Storage | +0.49% |
| 6. | Educational Services | +0.17% |
| 7. | Employment Services | +0.14% |
| 8. | Repair and Maintenance | +0.10% |
| 9. | Accommodation and Food Service | +0.07% |
| 10. | Management of Companies and Enterprises | +0.07% |
| 11. | Motor Vehicle and Parts Dealers | +0.01% |
| 12. | Financial Activities | -0.08% |
| 13. | Healthcare | -0.43% |
| 14. | Insurance Carriers and Related Activities | -0.46% |
To validate the predictive power of our data we compare our projections with Bureau of Labor Statistics historical data. What we find is a strong correlative relationship. When a job is easy to fill, immediately after posting a position employment goes up, as we see in the Manufacturing segment. If a job is harder to fill – as in Warehousing – we are a leading indicator. We can also see early indications of industry contractions when job postings in an economic sector decline, which is followed by a concomitant drop in the BLS measure of employment.
Here is an in-depth look at the top five industries by increased demand for employees:
Graph 1
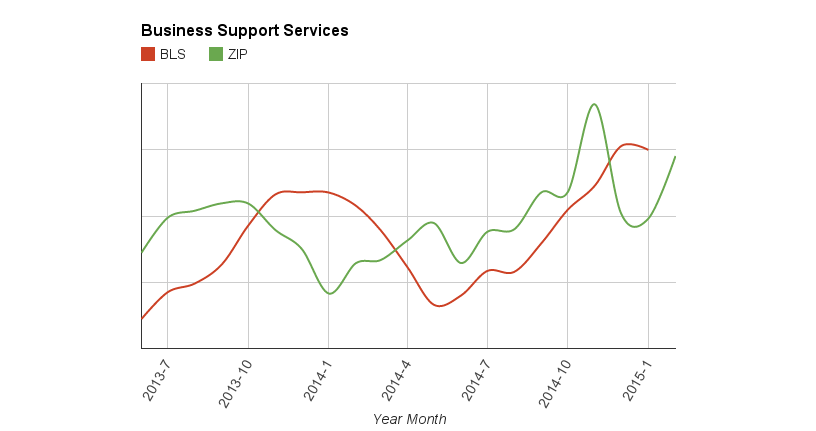
Based on our predictive curve, we should see completed hires in Business Support Services begin to trend upwards in the next two months.
Graph 2
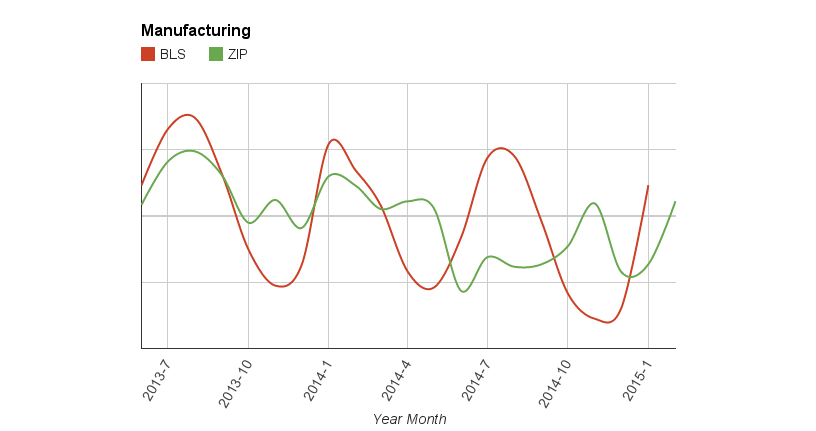
The trendline for Manufacturing returns to close alignment after an 8 month period where the supply of workers lagged slightly demand.
Graph 3
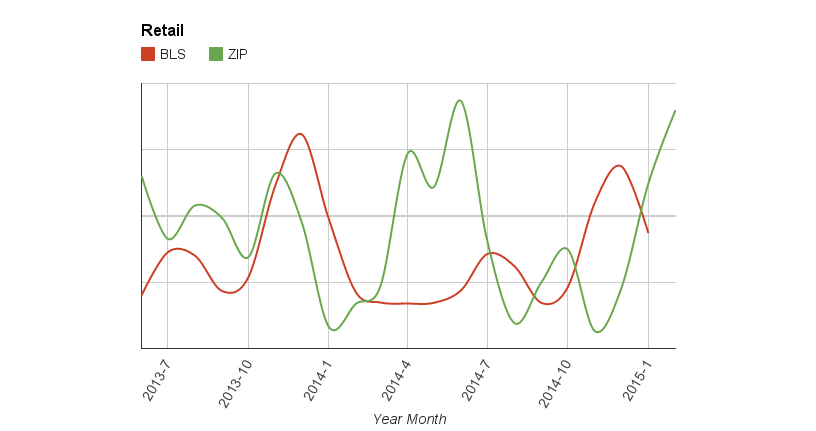
If current demand trends hold, hiring in Retail looks to see a surge in the next two months after the post-holiday contraction has worked itself out.
Graph 4
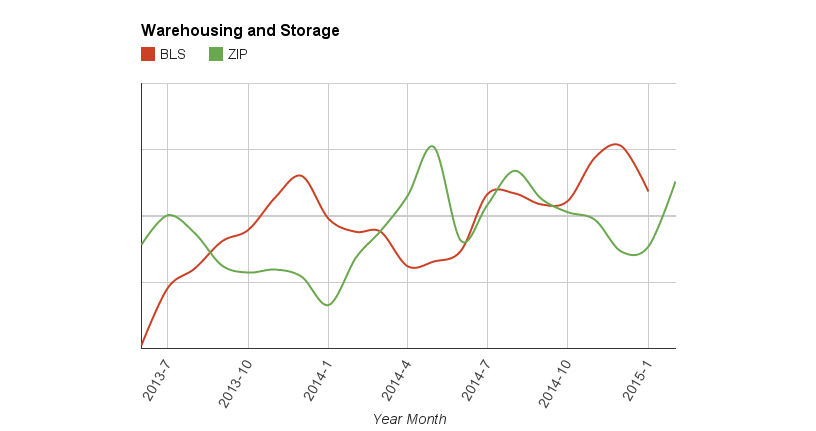
Warehousing and Storage looks set to return to a hiring posture, as demand rises to near its previous 18-month high.
Graph 5
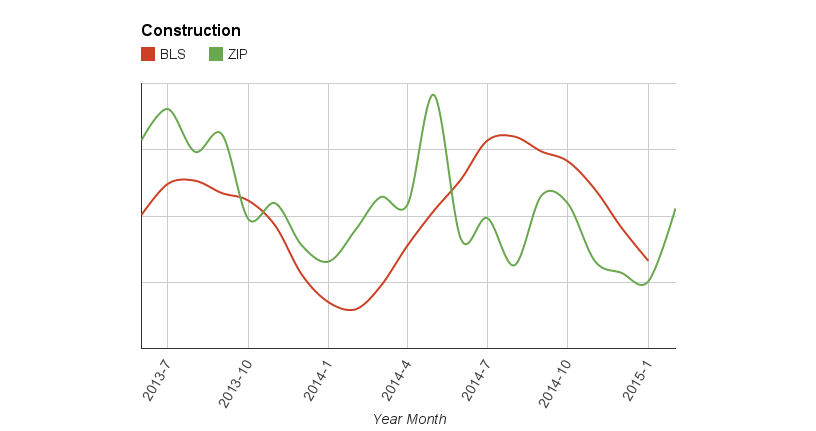
Demand for Construction has risen above the pace of hiring for the first time since June of last year, which indicates the current decline in hiring should reverse itself over the next few months.
Table 2
February’s Largest Relative Change in Hiring Demand by MSA
| MSA | Percent Change Month over Month |
|---|---|
| Los Angeles-Long Beach-Santa Ana, CA | +0.41% |
| Washington-Arlington-Alexandria, DC-VA-MD-WV | +0.24% |
| Philadelphia-Camden-Wilmington, PA-NJ-DE-MD | +0.23% |
| Pittsburgh, PA | +0.18% |
| Tampa-St. Petersburg-Clearwater, FL | +0.14% |
| Detroit-Warren-Livonia, MI | +0.12% |
| Baltimore-Towson, MD | +0.12% |
| Chicago-Naperville-Joliet, IL-IN-WI | +0.12% |
| Seattle-Tacoma-Bellevue, WA | +0.11% |
| Phoenix-Mesa-Scottsdale, AZ | +0.09% |
| Boston-Cambridge-Quincy, MA-NH | +0.07% |
| Dallas-Fort Worth-Arlington, TX | +0.07% |
| Indianapolis-Carmel, IN | +0.06% |
| Charlotte-Gastonia-Concord, NC-SC | -0.06% |
| Miami-Fort Lauderdale-Pompano Beach, FL | -0.07% |
| Atlanta-Sandy Springs-Marietta, GA | -0.09% |
| Nashville-Davidson-Murfreesboro-Franklin, TN | -0.10% |
| Sacramento-Arden-Arcade-Roseville, CA | -0.14% |
| San Francisco-Oakland-Fremont, CA | -0.22% |
| New York-Northern New Jersey-Long Island, NY-NJ-PA | -0.24% |
Table 3
Top 20 Job Titles by Job Posting Volume in February 2015
- Sales Representative
- Administrative Assistant
- Registered Nurse
- Customer Service Representative
- Project Manager
- Bank Teller
- Social Worker
- Account Manager
- Sales Associate
- General Labor
- Sales Manager
- CNA Certified Nursing Assistant
- Licensed Practical Nurse
- Business Analyst
- Executive Assistant
- Medical Support Assistant
- Account Executive
- Restaurant Manager
- Medical Assistant
- Branch Manager
The ZipRecruiter National Jobs Report measures current and leading edge demand for employees across fourteen key industries by measuring relative month over month percent changes using the following benchmarks:
- Current Active Jobs – Our representative sample of millions of job postings provides an overview of existing demand for new employees (as opposed to hiring numbers), which provides a snapshot of the previous month’s hiring.
- New Jobs – Our representative sample of new job postings in January provides insight into current and upcoming demand, next month’s hiring numbers, and a predictive look at the demand curve for new employees across twenty-one industries.
- Employer Demand by Metro – We have further broken down these numbers to provide insight into current and upcoming demand for new employees across metropolitan areas nationwide.
ZipRecruiter Data Scientist Leon Tchikindas contributed to this report.
Photo of Los Angeles (CC) via Flickr / Neil Kremer