In the coverage of the Department of Labor’s most recent jobs report, one remarkable point was largely missed: 73% of the new jobs created in November 2018 went to women. In fact, in every month of 2018, women were responsible for the lion’s share of job gains.
Of the 2.26 million net new jobs created so far in 2018 in the Labor Department’s establishment survey, 1.42 million (63%) went to women. The result is that over the course of the year, the employment-population ratio (EPOP) has risen 0.8 percentage points for women, compared with just 0.4 percentage points for men.
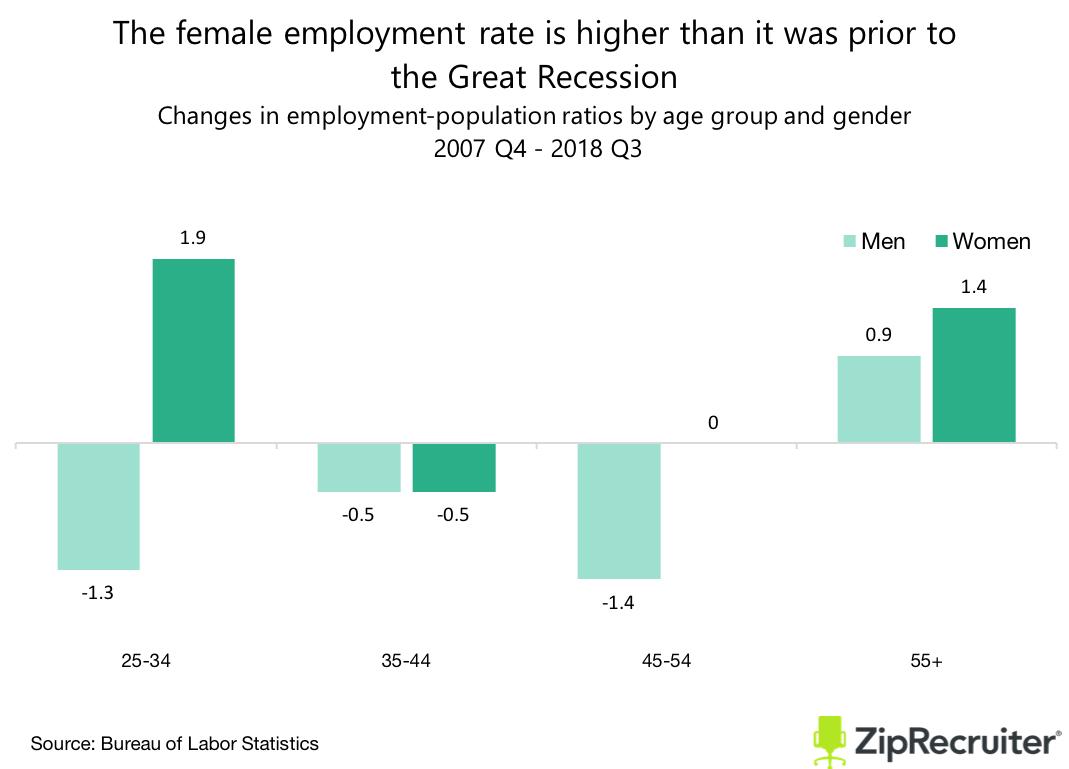
Prime-age EPOP is now 79.7% as of November 2018, exactly what it was in December 2007 before the Great Recession hit. But the labor market looks a little different. Prime-age male EPOP is down 0.8 percentage points, whereas prime-age female EPOP is up 0.7 percentage points.
What explains the divergent trends in male and female employment? There are likely four driving forces. The first is the increase in the average age of first-time moms. The surge in employment among younger women likely reflects that women are increasingly focusing on their careers in their twenties and early thirties and starting families later.
The second is tremendous employment growth in female-dominated occupations, predominantly in the healthcare sector. Of the 15 million net new jobs created between December 2007 and November 2018, more than a quarter were in the healthcare and social assistance sector. As of 2017, women made up the majority of employees in health diagnosing and treating occupations (74.4%), health technologist and technician occupations (77.4%), and healthcare support occupations (86.5%).
The third is the increase in the female share of total employment in other growing occupations, such as transportation. Rideshare apps appear to have opened driving occupations to women like never before. Traditionally, only 1% of New York cabbies have been women, but about 14% of Uber drivers, 30% of Lyft drivers, and 40% of Sidecar drivers are women.
| Occupations with increases in the female share of employment | Female share of total employment | ||
|---|---|---|---|
| 2007 | 2017 | Percent Change | |
| Transportation occupations | 11.4 | 14.6 | 28.07% |
| Farming, fishing, and forestry occupations | 20.5 | 24.4 | 19.02% |
| Construction and extraction occupations | 2.9 | 3.2 | 10.34% |
| Architecture and engineering occupations | 14.5 | 15.7 | 8.28% |
| Management occupations | 37.4 | 40.3 | 7.75% |
| Community and social services occupations | 61.5 | 66.2 | 7.64% |
| Material moving occupations | 20.3 | 21.6 | 6.40% |
| Life, physical, and social science occupations | 45.2 | 47.7 | 5.53% |
| Fire fighting and prevention, and other protective service workers including supervisors | 23.6 | 24.6 | 4.24% |
| Arts, design, entertainment, sports, and media occupations | 46.6 | 48.1 | 3.22% |
| Health diagnosing and treating practitioners and other technical occupations | 72.1 | 74.4 | 3.19% |
| Legal occupations | 50.7 | 52.2 | 2.96% |
| Building and grounds cleaning and maintenance occupations | 39.1 | 40 | 2.30% |
| Business and financial operations occupations | 54.4 | 55.3 | 1.65% |
| Sales and related occupations | 49.3 | 49.8 | 1.01% |
| Source: American Community Survey (ACS) 2007 and 2017 one-year estimates | |||
| Occupations with decreases in the female share of employment | Female share of total employment | ||
|---|---|---|---|
| 2007 | 2017 | Percent Change | |
| Installation, maintenance, and repair occupations | 4.4 | 3.9 | -11.36% |
| Computer and mathematical occupations | 27.5 | 25.4 | -7.64% |
| Food preparation and serving related occupations | 56.4 | 53.8 | -4.61% |
| Office and administrative support occupations | 73.8 | 70.8 | -4.07% |
| Production occupations | 29.6 | 28.8 | -2.70% |
| Law enforcement workers including supervisors | 20.2 | 19.7 | -2.48% |
| Healthcare support occupations | 88.3 | 86.5 | -2.04% |
| Health technologists and technicians | 78.7 | 77.4 | -1.65% |
| Personal care and service occupations | 78 | 77.5 | -0.64% |
| Education, training, and library occupations | 73.3 | 73.1 | -0.27% |
| Source: American Community Survey (ACS) 2007 and 2017 one-year estimates |
The fourth is that women outnumber men in colleges and grad schools. Women earned the majority of doctoral degrees in 2017 for the 9th straight year, and they outnumber men in grad school by 137 to 100, according to the Council of Graduate Schools. Women earned a majority of doctoral degrees in 7 of 11 fields tracked by the Council of Graduate Schools, including Biology, Health and Medical Sciences. Women have earned more bachelor’s degrees than men since 1982, and they have increased their share of the total each year since.
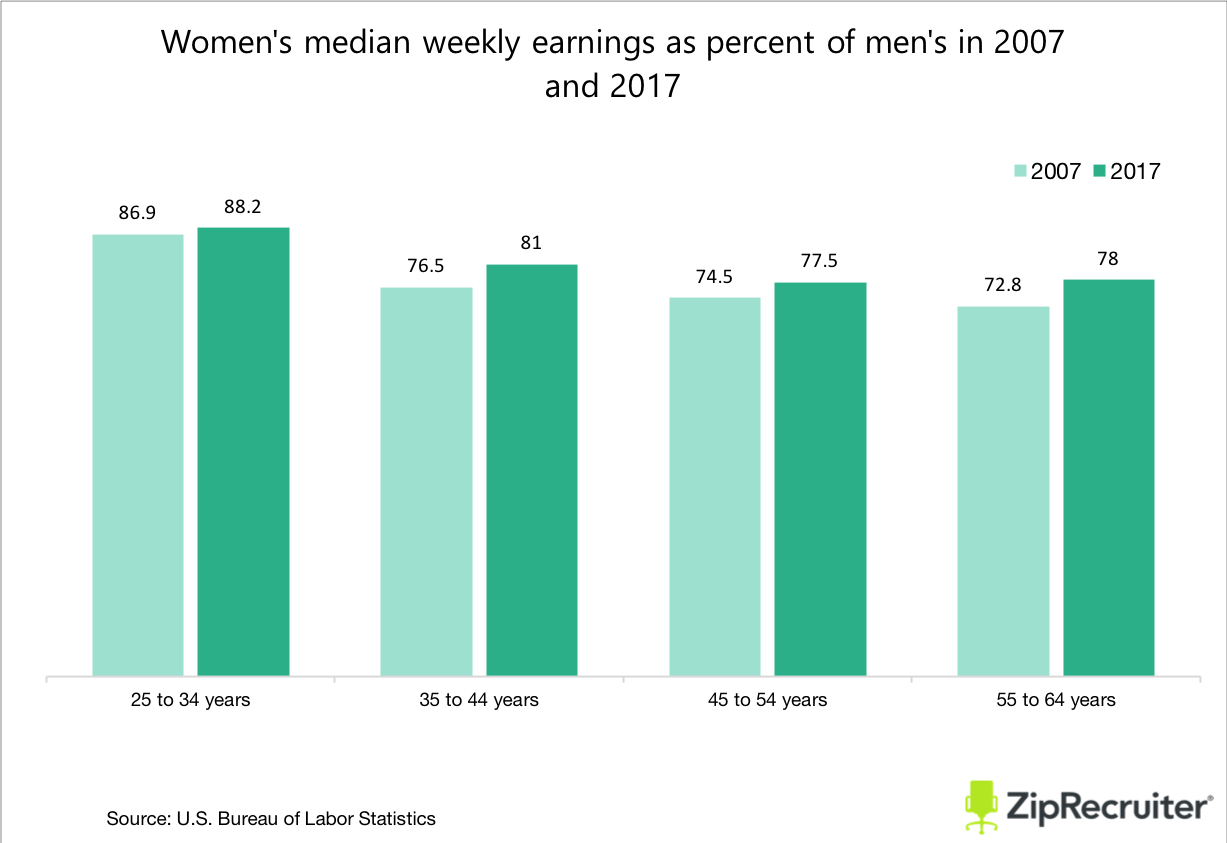
The growth in women’s employment opportunities has not only manifested itself in job gains but also in earnings growth. Over the past decade, women’s earnings have risen as a percent of men’s for prime-age Americans within each age group. To be fair, they haven’t risen by terribly much–if we sustain this pace of growth, it would take 50-100 years for each of the groups to achieve earnings parity–but the change has been large enough to make a meaningful difference.